さて、機械学習理論入門の続きだ。次は、k平均法について勉強しよう。
k平均法は、データの集合をいくつかの部分集合にクラスタリングするアルゴリズムだ。このとき、パーセプトロンのように、教師データ(つまり、答え)がある訳ではなく、教師データが無い中で、データを分類していく。
パーセプトロンは、 - 教師あり: 教師データを元に、データを分類する境界線を見つけていく 一方で、k平均法は、 - 教師無し: 入力データだけを元に、データを複数のクラスタに分類していく
この教師無し学習の最も基本となるのが、k平均法というものらしい。詳細は、書籍を参照したり、ググったりして欲しいのだが、要するに、
- 最初に、ランダムに分類する
- 最初の分類結果からコストを計算し、そこから新しい分類基準を作成する。
- 新しい分類基準を元に再度データを分類し、再度コストを計算する
という感じで、2.と3.を交互に実行してく。今回も、「機械学習理論入門」の第6章を例を参考に、(X,Y)上にプロットされた複数のデータを、分類していこう。
分類対象
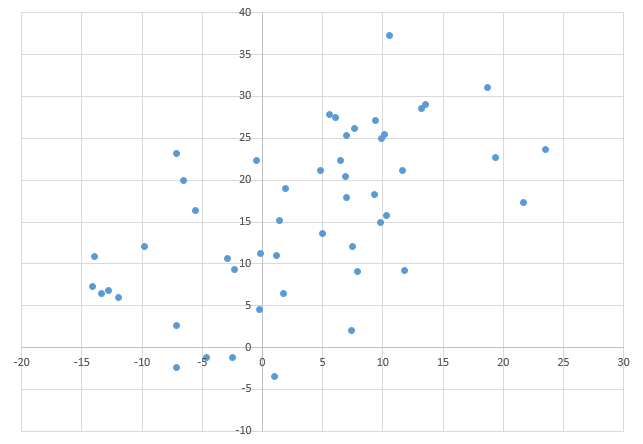
以下のような、(X,Y)上にプロットされた50個のデータを、2つの領域にクラスタリングすることを考える。

k平均法による分類方法
これも参考書籍に則るが、基本的に以下のような手順を踏む。
- ランダムな、「代表点」を用意する。ここでは、2種類にクラスタリングするので、2種類の代表点を用意する(これは最初に乱数で生成する)
- トレーニングセット内で「どちらの代表点に近いか」を計算する。これは、代表点と、各点の距離を計算する 2.1. 各点について、距離の近い方の代表点に属するとする
- 2.により分類されたクラスタで、それぞれ重心を計算する(つまり、各クラスタの座標点の平均値を計算する)
- 3.により得られた代表点を元にして、再度トレーニングセットがどちらのクラスタに分類されるかを計算する。
ここまで書いてみてふと思うのだが、これって別に機械学習というよりも、単なるアルゴリズムだよね。とは言っても、TensorFlowでは機械学習だけでなく、普通の計算もこなすことが出来るので、TensorFlowを使ってみよう。 例えば、TensorFlowの例として、微分方程式を解く例がある。これは、何かを最小化するというよりも、何度も繰り返し計算をして、近似値を出している、という例だ。
http://www.tensorflow.org/tutorials/pdes/index.html#partial-differential-equations
TensorFlowによる実装
ランダムデータセットを作成する
これはいつもの通りだ。(X, Y)のペアになるデータセットを50個作成した。
for idx in range(0, N1):
    radius = Variances * np.random.random()
    radian = np.random.uniform(0, 2*math.pi)
    x = radius * math.cos(radian) + Mu1[0]
    y = radius * math.sin(radian) + Mu1[1]

    group.append([x, y])

for idx in range(0, N2):
    radius = Variances * np.random.random()
    radian = np.random.uniform(0, 2*math.pi)
    x = radius * math.cos(radian) + Mu2[0]
    y = radius * math.sin(radian) + Mu2[1]

    group.append([x, y])
前回のソースコードを流用しているため、若干2つのクラスタに分かれている状態からスタートしよう。
最初の代表点を作成する
これもランダム値だ。この変数を更新していくことで、より正確な2クラスタの代表点に近づけていく。
W0 = tf.Variable([50 * np.random.random(), 50 * np.random.random()])
W1 = tf.Variable([50 * np.random.random(), 50 * np.random.random()])
代表点からデータセットまでの距離を算出し、近い方へクラスタリングする。
距離の計算は簡単、クラスタリングは、TensorFlowの機能である比較演算や、三項演算子を使おう。
dist_W0 = tf.sqrt(tf.reduce_sum(tf.pow(grp - W0, tf.constant(2.)), 1))
dist_W1 = tf.sqrt(tf.reduce_sum(tf.pow(grp - W1, tf.constant(2.)), 1))

class_W0 = tf.select(tf.less   (dist_W0, dist_W1), tf.constant(1., shape=[N1+N2]), tf.constant(0., shape=[N1+N2]))
class_W1 = tf.select(tf.greater(dist_W0, dist_W1), tf.constant(1., shape=[N1+N2]), tf.constant(0., shape=[N1+N2]))
class_W0がW0側に分類されるデータ、class_W1がW1側に分類されるデータだ。分類される方に、1が格納される。 ちなみに、最初はランダム代表点が下手糞なところに生成されるため、分類結果は以下のようになることが多く、ほぼ片方のクラスタに分類されてしまう。
[ 1.  0.  1.  0.  0.  0.  0.  1.  0.  0.  0.  0.  0.  0.  0.  1.  0.  0.
  0.  0.  0.  0.  0.  0.  0.  0.  0.  0.  0.  0.  0.  0.  0.  0.  0.  0.
  0.  0.  0.  0.  0.  0.  0.  0.  0.  0.  0.  0.  0.  0.]
[ 0.  1.  0.  1.  1.  1.  1.  0.  1.  1.  1.  1.  1.  1.  1.  0.  1.  1.
  1.  1.  1.  1.  1.  1.  1.  1.  1.  1.  1.  1.  1.  1.  1.  1.  1.  1.
  1.  1.  1.  1.  1.  1.  1.  1.  1.  1.  1.  1.  1.  1.]
ほぼほぼclass_W1に分類されていることが分かる。これを、重心を再計算することでアップデートしていこう。
重心の再計算
これが若干トリッキーだった。TensorFlowの機能を駆使しなければならないが、
- W0_mean, W1_mean : 各データセットと、クラスタリングの結果から各エレメントの積を取り、結果を合計する(X,Yにつき)
- W0_mean, W1_mean : クラスタリングされたデータセット数で割り算し、重心を求める。
W0_mean_ = tf.reduce_sum(tf.mul(grp, tf.transpose(tf.reshape(tf.concat(0, [class_W0, class_W0]), [2, N1+N2]))), 0)
W1_mean_ = tf.reduce_sum(tf.mul(grp, tf.transpose(tf.reshape(tf.concat(0, [class_W1, class_W1]), [2, N1+N2]))), 0)

W0_mean = W0_mean_ / tf.reduce_sum(class_W0)
W1_mean = W1_mean_ / tf.reduce_sum(class_W1)
W0_mean, W1_mean の計算では、concatを使ったり、transposeを使ったりして、どうにかこうにか、所望のデータセットが手に入るようにしている。ここらへんは、TensorFlowのAPIを参考にしてほしい。
重心点のアップデート
これには、assignとgroupを使って、繰り返し計算時に、変数がアップデートされるように仕掛ける。
step = tf.group(W0.assign(W0_mean), W1.assign(W1_mean))
W0 <= W0_mean, W1 <= W1_meanを繰替えしている。
重心点アップデートの繰り返し
for j in range(1000):
    sess.run(step)
さて、結果はどうなったかな?
クラスタリング結果
分類されたデータセット
19.3623147953 22.7206128181
13.2064828898 28.5448922889
10.510147248 37.2587531241
6.47245313631 22.3195197056
10.2869582545 15.7320279336
13.5235240727 29.072548114
4.79579047813 21.1611612612
18.6609378824 31.0080406025
9.91177555014 25.0262641036
6.94976723744 17.9547960188
5.60265260127 27.7792722064
21.6443611351 17.3089229863
7.47138099134 12.0542089943
7.01483296202 25.3458145461
10.1401504475 25.4777535056
23.4915160916 23.665023333
6.05093534853 27.4263111142
9.39538861222 27.1561518981
11.6639375352 21.1384102868
7.63344788778 26.1304643463
9.80084604895 14.9184714896
-0.48052234617 22.3864330938
1.951462735 19.0067242104
11.7629440396 9.2057582054
6.88450810136 20.3749619235
5.01979018471 13.6020217688
9.30959484435 18.3290127806

-14.1103659966 7.32199597142
-11.9288139346 6.00630364899
-2.4693683352 -1.22038520437
-7.14588863409 23.1516369763
-2.93688222614 10.6499997795
-7.09853038371 2.69207176558
-13.3886048734 6.47451599664
-5.57658056965 16.3474749813
-6.59515592919 19.9712401038
-7.14442770332 -2.38869249923
1.4015259838 15.1762551307
-2.3252755988 9.31973816287
1.19089898022 11.0049880999
-0.272669261331 4.59738271431
0.998581711957 -3.43600876017
-4.66035849503 -1.16293395991
-12.8029807738 6.85803954725
-13.9696580741 10.8532807641
1.77157993258 6.47534346632
7.90516601483 9.08701042352
7.37547683537 2.06129079043
-0.137222082117 11.2049429141
-9.75385071677 12.1325848122
代表点平均値
9.92731 22.3002
-4.42058 7.96426
クラスタリング結果
[ 1.  1.  1.  1.  1.  1.  1.  1.  1.  1.  1.  1.  1.  1.  1.  1.  1.  1.
  1.  1.  0.  0.  1.  0.  0.  0.  0.  1.  0.  0.  0.  0.  0.  0.  0.  0.
  1.  0.  0.  1.  1.  0.  0.  0.  0.  1.  0.  0.  0.  1.]
[ 0.  0.  0.  0.  0.  0.  0.  0.  0.  0.  0.  0.  0.  0.  0.  0.  0.  0.
  0.  0.  1.  1.  0.  1.  1.  1.  1.  0.  1.  1.  1.  1.  1.  1.  1.  1.
  0.  1.  1.  0.  0.  1.  1.  1.  1.  0.  1.  1.  1.  0.]
ほぼ半分ずつくらいに分類されているね。Excelで分類結果を表示させてみよう。

お、いい感じだね!
ソースコード
import tensorflow as tf
import numpy as np
import random
import math

N1 = 20
Mu1 = [10,25]

N2 = 30
Mu2 = [0, 10]

Variances = 15

group = []

for idx in range(0, N1):
    radius = Variances * np.random.random()
    radian = np.random.uniform(0, 2*math.pi)
    x = radius * math.cos(radian) + Mu1[0]
    y = radius * math.sin(radian) + Mu1[1]

    group.append([x, y])

for idx in range(0, N2):
    radius = Variances * np.random.random()
    radian = np.random.uniform(0, 2*math.pi)
    x = radius * math.cos(radian) + Mu2[0]
    y = radius * math.sin(radian) + Mu2[1]

    group.append([x, y])

grp = tf.Variable(group)


W0 = tf.Variable([50 * np.random.random(), 50 * np.random.random()])
W1 = tf.Variable([50 * np.random.random(), 50 * np.random.random()])

dist_W0 = tf.sqrt(tf.reduce_sum(tf.pow(grp - W0, tf.constant(2.)), 1))
dist_W1 = tf.sqrt(tf.reduce_sum(tf.pow(grp - W1, tf.constant(2.)), 1))

class_W0 = tf.select(tf.less   (dist_W0, dist_W1), tf.constant(1., shape=[N1+N2]), tf.constant(0., shape=[N1+N2]))
class_W1 = tf.select(tf.greater(dist_W0, dist_W1), tf.constant(1., shape=[N1+N2]), tf.constant(0., shape=[N1+N2]))

W0_mean_ = tf.reduce_sum(tf.mul(grp, tf.transpose(tf.reshape(tf.concat(0, [class_W0, class_W0]), [2, N1+N2]))), 0)
W1_mean_ = tf.reduce_sum(tf.mul(grp, tf.transpose(tf.reshape(tf.concat(0, [class_W1, class_W1]), [2, N1+N2]))), 0)

W0_mean = W0_mean_ / tf.reduce_sum(class_W0)
W1_mean = W1_mean_ / tf.reduce_sum(class_W1)


step = tf.group(W0.assign(W0_mean), W1.assign(W1_mean))

init = tf.initialize_all_variables()
sess = tf.Session()
sess.run(init)

# print sess.run(class_W0)
# print sess.run(class_W1)
#
# print sess.run(W0)[0], sess.run(W0)[1]
# print sess.run(W1)[0], sess.run(W1)[1]

for j in range(1000):
    sess.run(step)

# for idx in range(0, N1+N2):
#     print group[idx][0], group[idx][1]
#
# print ""

for idx in range(0, N1+N2):
    if sess.run(class_W0)[idx] == 1:
        print group[idx][0], group[idx][1]

print ""

for idx in range(0, N1+N2):
    if sess.run(class_W1)[idx] == 1:
        print group[idx][0], group[idx][1]

print sess.run(W0)[0], sess.run(W0)[1]
print sess.run(W1)[0], sess.run(W1)[1]

print sess.run(class_W0)
print sess.run(class_W1)
参考書籍

- 作者: 中井悦司
- 出版社/メーカー: 技術評論社
- 発売日: 2015/10/17
- メディア: 単行本(ソフトカバー)
- この商品を含むブログを見る