CNTK 2.0について勉強する。CNTKはTensorFlowと同様にチュートリアルが用意されており、これを進めていくことにしよう。
まずは、Logistic Regression(回帰分析)をCNTKのニューラルネットワークで構成し、回帰分析を学習してみる。
https://github.com/Microsoft/CNTK/blob/v2.0/Tutorials/CNTK_101_LogisticRegression.ipynb
CNTK 2.0を用いた回帰分析
CNTK 101チュートリアルでは、回帰分析を用いてデータの分類を行う。ここで例として取り上げられているのは、2種類の要素(年齢、腫瘍の大きさ)に対するガン腫瘍であるかどうかを識別する回帰分析だ。つまり、X軸を年齢、Y軸を腫瘍の大きさ都市、それがガン腫瘍であるかどうかを識別するものとなる。 以下のようなグラフをプロットすることができ、青色のプロットが良性腫瘍、赤色のプロットが悪性腫瘍となる。 さらに、下記のような回帰直線を引くことで、良性と悪性の境界線を引くことができるようになる。
from IPython.display import Image
Image(url="https://www.cntk.ai/jup/cancer_data_plot.jpg", width=400, height=400)

Image(url= "https://www.cntk.ai/jup/cancer_classify_plot.jpg", width=400, height=400)

回帰分析においては、各種パラメータをニューラルネットワークに入力し、良性か悪成果を示すラベル(0, 1)を出力するということになる。これにはSigmoid関数とSoftmax関数を利用する。
まず、Python実行環境について確認しておこう。CNTKでは環境変数を利用して実行する環境を選択する(GPU or CPU)。デフォルトでは、CNTKは選択可能なデバイスの中で最良のもの(CPUよりGPU)を選択する。
まあ、下記の試行では私の環境ではCPUもGPUも特に選択されなかったのだけど。なんでだ。
# Import the relevant components
from __future__ import print_function
import numpy as np
import sys
import os
from cntk import *

import cntk as C
# Select the right target device when this notebook is being tested:
if 'TEST_DEVICE' in os.environ:
    if os.environ['TEST_DEVICE'] == 'cpu':
        C.device.try_set_default_device(C.device.cpu())
        print ("CNTK selected CPU device")
    else:
        C.device.try_set_default_device(C.device.gpu(0))
        print ("CNTK selected GPU device")
まずは入力データの生成を行う。ここでは2次元のデータとして、X軸は年齢、Y軸は腫瘍の大きさを示すデータを生成する。
# Define the network
input_dim = 2
num_output_classes = 2

# Ensure we always get the same amount of randomness
np.random.seed(0)

# Helper function to generate a random data sample
def generate_random_data_sample(sample_size, feature_dim, num_classes):
    # Create synthetic data using NumPy.
    Y = np.random.randint(size=(sample_size, 1), low=0, high=num_classes)

    # Make sure that the data is separable
    X = (np.random.randn(sample_size, feature_dim)+3) * (Y+1)

    # Specify the data type to match the input variable used later in the tutorial
    # (default type is double)
    X = X.astype(np.float32)

    # converting class 0 into the vector "1 0 0",
    # class 1 into vector "0 1 0", ...
    class_ind = [Y==class_number for class_number in range(num_classes)]
    Y = np.asarray(np.hstack(class_ind), dtype=np.float32)
    return X, Y
# Create the input variables denoting the features and the label data. Note: the input
# does not need additional info on number of observations (Samples) since CNTK creates only
# the network topology first
mysamplesize = 32
features, labels = generate_random_data_sample(mysamplesize, input_dim, num_output_classes)
いくつか主要なコードをまとめておこう。このデータ群はかなり恣意的に作られている。つまり、最初のYの生成時にあらかじめ両性候補、悪性候補を01で区分けしておき、良性のものは小さな倍率、悪性のものは大きな倍率で配列Xを生成することでデータに恣意的な偏りを発生させている。 ニューラルネットワークでその偏りを認識して、境界線を引こうという考え方だ。
また、class_ind変数んについても、Y値(良性か悪性かを示す)によってYの値を決めておき、最終的にfeaturesとlabelsは以下のように生成されているはずだ。
同様にプロットしてみると以下のようになる。
print (np.hstack((features, labels)))
# Plot the data
import matplotlib.pyplot as plt
%matplotlib inline

# given this is a 2 class ()
colors = ['r' if l == 0 else 'b' for l in labels[:,0]]

plt.scatter(features[:,0], features[:,1], c=colors)
plt.xlabel("Scaled age (in yrs)")
plt.ylabel("Tumor size (in cm)")
plt.show()
[[  3.44386315   3.33367443   1.           0.        ]
 [  8.98815823   5.58968353   0.           1.        ]
 [  6.62613535   4.29180861   0.           1.        ]
 [  0.44701019   3.65361857   1.           0.        ]
 [  7.7288723    4.51566982   0.           1.        ]
 [ 10.53950882   3.09126854   0.           1.        ]
 [  6.09151697   5.62563229   0.           1.        ]
 [  9.06555843   8.93871784   0.           1.        ]
 [  6.30989504   6.75632524   0.           1.        ]
 [  4.22442865   2.03840709   0.           1.        ]
 [  5.30417585   6.31269789   0.           1.        ]
 [  4.23029089   4.2023797    1.           0.        ]
 [  2.61267328   2.69769716   1.           0.        ]
 [  3.90289402   3.15996408   0.           1.        ]
 [  1.29372978   4.95077562   1.           0.        ]
 [  2.49034786   2.56192565   1.           0.        ]
 [  1.74720466   3.77749038   1.           0.        ]
 [  1.3861022    2.78725982   1.           0.        ]
 [  2.10453343   3.38690257   1.           0.        ]
 [  4.97838974   3.63873553   0.           1.        ]
 [  2.97181773   3.42833185   1.           0.        ]
 [  6.13303423   6.60494375   0.           1.        ]
 [  4.73135567   5.27451754   0.           1.        ]
 [  2.32753944   2.6404469    1.           0.        ]
 [  2.18685365   1.2737174    1.           0.        ]
 [  6.3548522    5.19643831   0.           1.        ]
 [  2.73960328   6.92556429   0.           1.        ]
 [  4.18540335   6.1038909    0.           1.        ]
 [  7.4581809    6.25796604   0.           1.        ]
 [  4.13940048   1.76517415   1.           0.        ]
 [  6.80468321   4.63037968   0.           1.        ]
 [  2.12920284   2.42115045   1.           0.        ]]
[f:id:msyksphinz:20170618215531p:plain]
ネットワークモデルの作成
ここでは、回帰分析のネットワークを作成する。入力値x_iに対して重みw_iの積を計算し、さらにバイアス値を加算する。
CNTKでは、入力値の定義として以下のinput_variableを利用する。
- input variable: ユーザコードの入力値を受け取るためのコンテナ。inputの形は入力されるデータの形と同一である。例えば、入力が高さ10ピクセル、幅5ピクセルのデータであれば、入力値の次元は2となる。
feature = C.input_variable(input_dim, np.float32)
ネットワークをセットアップする。ここではlinear_layerという関数を作成する。ここでは、入力値であるxと重みwの積を計算し、bias_paramを加算する。timesは行列積を実行するCNTKの組み込み関数である。weight_param変数は(2, 2)の行列、bias_param変数は(1, 2)の行列なので、結果は(1, 2)の行列積となる。
# Define a dictionary to store the model parameters
mydict = {"w":None,"b":None}

def linear_layer(input_var, output_dim):

    input_dim = input_var.shape[0]
    weight_param = C.parameter(shape=(input_dim, output_dim))
    bias_param = C.parameter(shape=(output_dim))

    mydict['w'], mydict['b'] = weight_param, bias_param

    return C.times(input_var, weight_param) + bias_param
output_dim = num_output_classes
z = linear_layer(feature, output_dim)
最後に出力値に対して、Softmax関数を適用して終了となる。さらに、誤差を計算するためにeval_errorを定義する。
classification_error(output_vector, target_vector): 類似度を計算する。output_vectorの最大値が、target_vectorと一致しているかをチェックする。
print (C.classification_error([[1., 2., 3., 4.]], [[0., 0., 0., 1.]]).eval())
print (C.classification_error([[1., 2., 3., 4.]], [[0., 0., 1., 0.]]).eval())
print (C.classification_error([[1., 2., 3., 4.]], [[5., 0., 1., 0.]]).eval())
label = C.input_variable((num_output_classes), np.float32)
loss = C.cross_entropy_with_softmax(z, label)
eval_error = C.classification_error(z, label)
[[ 0.]]
[[ 1.]]
[[ 1.]]
トレーニングの構成
誤差を最小にするための手法として、Stochastic Gradient Descent(SGD)を利用する。SGDによる最適化は、予測値と誤差の値を計算して、次の重みの勾配を計算するというわけだ。
# Instantiate the trainer object to drive the model training
learning_rate = 0.5
lr_schedule = C.learning_rate_schedule(learning_rate, C.UnitType.minibatch)
learner = C.sgd(z.parameters, lr_schedule)
trainer = C.Trainer(z, (loss, eval_error), [learner])
さらに、いくつかトレーニングの進捗を確認するための関数群を用意しておく。
# Define a utility function to compute the moving average sum.
# A more efficient implementation is possible with np.cumsum() function
def moving_average(a, w=10):
    if len(a) < w:
        return a[:]
    return [val if idx < w else sum(a[(idx-w):idx])/w for idx, val in enumerate(a)]


# Defines a utility that prints the training progress
def print_training_progress(trainer, mb, frequency, verbose=1):
    training_loss, eval_error = "NA", "NA"

    if mb % frequency == 0:
        training_loss = trainer.previous_minibatch_loss_average
        eval_error = trainer.previous_minibatch_evaluation_average
        if verbose:
            print ("Minibatch: {0}, Loss: {1:.4f}, Error: {2:.2f}".format(mb, training_loss, eval_error))

    return mb, training_loss, eval_error
トレーニングの実行
ここでは、25個のサンプルを一つのminibatch_sizeとしてトレーニングを実施し、20000個の値に対してトレーニングを実施する。ここで、もし10000個しかデータが存在しない場合、同一のトレーニングを2回実施する。
# Initialize the parameters for the trainer
minibatch_size = 25
num_samples_to_train = 20000
num_minibatches_to_train = int(num_samples_to_train  / minibatch_size)

# Run the trainer and perform model training
training_progress_output_freq = 50

plotdata = {"batchsize":[], "loss":[], "error":[]}

for i in range(0, num_minibatches_to_train):
    features, labels = generate_random_data_sample(minibatch_size, input_dim, num_output_classes)

    # Specify input variables mapping in the model to actual minibatch data to be trained with
    trainer.train_minibatch({feature : features, label : labels})
    batchsize, loss, error = print_training_progress(trainer, i,
                                                     training_progress_output_freq, verbose=1)

    if not (loss == "NA" or error =="NA"):
        plotdata["batchsize"].append(batchsize)
        plotdata["loss"].append(loss)
        plotdata["error"].append(error)
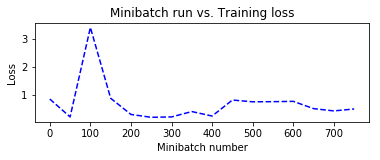
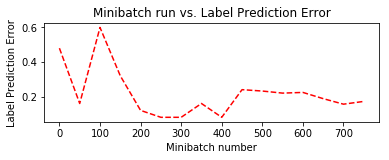
Minibatch: 0, Loss: 0.8454, Error: 0.48
Minibatch: 50, Loss: 0.2030, Error: 0.16
Minibatch: 100, Loss: 3.4171, Error: 0.60
Minibatch: 150, Loss: 0.8732, Error: 0.32
Minibatch: 200, Loss: 0.2916, Error: 0.12
Minibatch: 250, Loss: 0.1891, Error: 0.08
Minibatch: 300, Loss: 0.2029, Error: 0.08
Minibatch: 350, Loss: 0.3956, Error: 0.16
Minibatch: 400, Loss: 0.2349, Error: 0.08
Minibatch: 450, Loss: 0.8095, Error: 0.24
Minibatch: 500, Loss: 0.8910, Error: 0.36
Minibatch: 550, Loss: 0.3185, Error: 0.20
Minibatch: 600, Loss: 0.8056, Error: 0.24
Minibatch: 650, Loss: 0.0492, Error: 0.00
Minibatch: 700, Loss: 0.9879, Error: 0.28
Minibatch: 750, Loss: 0.3846, Error: 0.12
# Compute the moving average loss to smooth out the noise in SGD
plotdata["avgloss"] = moving_average(plotdata["loss"])
plotdata["avgerror"] = moving_average(plotdata["error"])

# Plot the training loss and the training error
import matplotlib.pyplot as plt

plt.figure(1)
plt.subplot(211)
plt.plot(plotdata["batchsize"], plotdata["avgloss"], 'b--')
plt.xlabel('Minibatch number')
plt.ylabel('Loss')
plt.title('Minibatch run vs. Training loss')

plt.show()

plt.subplot(212)
plt.plot(plotdata["batchsize"], plotdata["avgerror"], 'r--')
plt.xlabel('Minibatch number')
plt.ylabel('Label Prediction Error')
plt.title('Minibatch run vs. Label Prediction Error')
plt.show()


評価とテスト
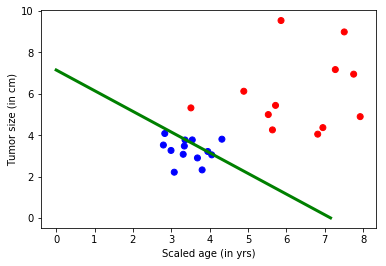
最後に、トレーニングを実施したネットワークに対してデータを入力して評価を行う。新しいデータを生成して、平均誤差と損失を計算する。
これにはtrainer.test_minibatchを使用する。
# Run the trained model on newly generated dataset
test_minibatch_size = 25
features, labels = generate_random_data_sample(test_minibatch_size, input_dim, num_output_classes)

trainer.test_minibatch({feature : features, label : labels})

out = C.softmax(z)
result = out.eval({feature : features})

print("Label    :", [np.argmax(label) for label in labels])
print("Predicted:", [np.argmax(result[i,:]) for i in range(len(result))])

# Model parameters
print(mydict['b'].value)

bias_vector   = mydict['b'].value
weight_matrix = mydict['w'].value

# Plot the data
import matplotlib.pyplot as plt

# given this is a 2 class
colors = ['r' if l == 0 else 'b' for l in labels[:,0]]
plt.scatter(features[:,0], features[:,1], c=colors)
plt.plot([0, bias_vector[0]/weight_matrix[0][1]],
         [ bias_vector[1]/weight_matrix[0][0], 0], c = 'g', lw = 3)
plt.xlabel("Scaled age (in yrs)")
plt.ylabel("Tumor size (in cm)")
plt.show()
Label    : [1, 1, 0, 0, 0, 0, 1, 0, 1, 1, 0, 0, 1, 1, 1, 0, 0, 1, 0, 1, 0, 1, 1, 0, 0]
Predicted: [1, 1, 0, 0, 0, 1, 1, 0, 1, 1, 0, 0, 1, 1, 1, 0, 0, 1, 0, 1, 0, 1, 1, 0, 0]
[ 7.92942953 -7.92942286]
